The purpose of this experiment was to model the relationship between period and mass and to use that model to calculate the mass of an object.
PROCEDURES
 |
| Figure 1: Our set-up of a photogate (left) and an inertial balance (right) |

T = A (m + M_tray)^n.
Next, we took the natural logarithm of both sides to get:
ln T = n ln (m + M_tray) + ln A.
Then, we graphed ln T versus ln total mass (we used the notation total mass instead of m + M_tray to simplify the variables) to see how close our guess for the mass of the inertial balance's tray was. This graph is illustrated below in Figure 3.
 |
| Figure 3: This graph models the relationship between mass and period |
From Figure 3, it can be seen that the correlation coefficient was 0.9976. Since the correlation coefficient describes how linear the data points are depending on how close the value is to one, we concluded that we needed to keep guessing different values for the mass of the tray (M_tray) in order to get a straighter line. We guessed several values for M_tray until we were able to produce a graph with a correlation coefficient of 0.9999. We found that two values, 260 grams and 300 grams, allowed us to achieve this. The graph from using 300 grams as M_tray is displayed in Figure 4.
 |
| Figure 4: Graph with a correlation coefficient of 0.9999 |
Since we found that both 260 grams and 300 grams gave us a correlation of 0.9999, we came to the conclusion that the actual mass of the tray was somewhere in between those numbers. We believed that the mass of the tray was close to 280 grams with an uncertainty of +/- 5 grams. Furthermore, from these graphs, we were finally able to derive values for the constants A and n. A was the y-intercept of the graphs and n was the slope.
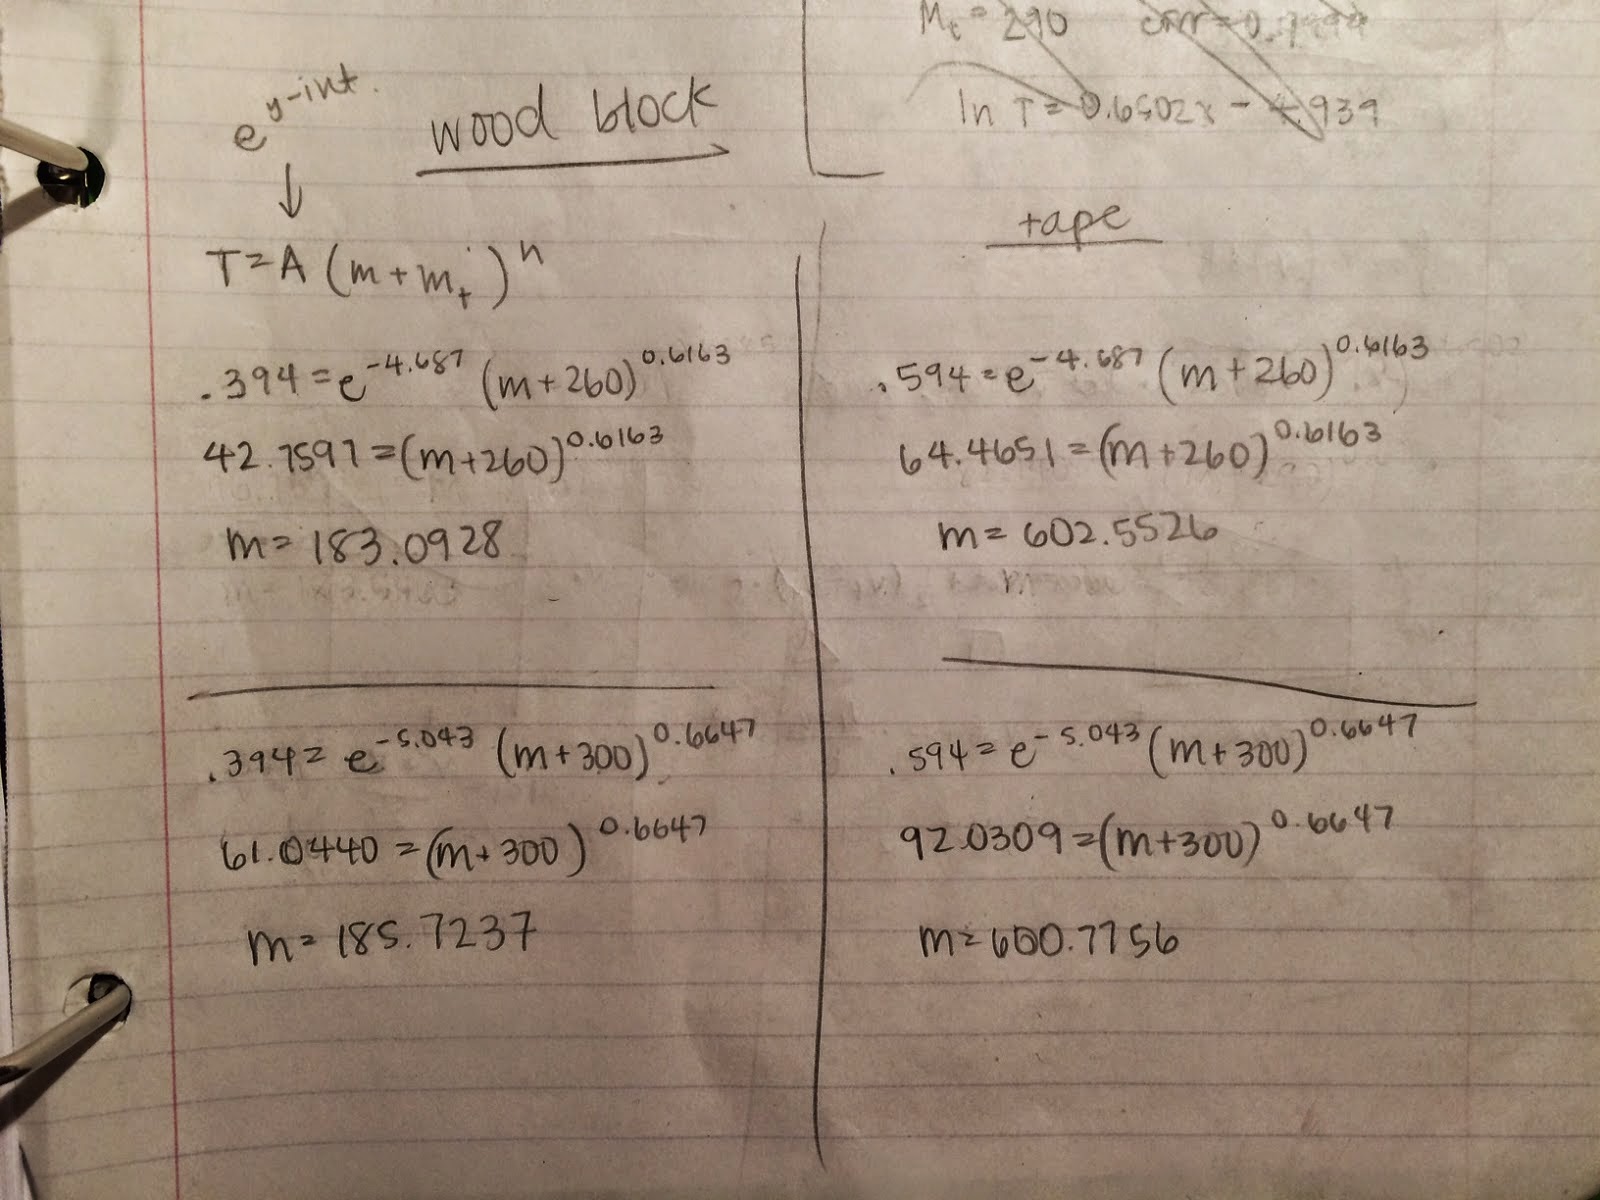 |
| Figure 5: Calculations for unknown masses |
Using the values derived from the steps above, we were able to calculate the masses of two objects by applying the mathematical model developed. The first object we used was an wooden block. By plugging in the values that we got of its period and the constants that we derived from before, we were able to find its mass to be 183.1 grams when considering M_tray to be 260 grams and 185.7 grams when M_tray was 300 grams. The next object that we tried to measure was a tape dispenser. We found its mass to be 602.6 grams when M_tray is set at 260 grams and 600.1 grams when M_tray is configured to be 300 grams. After we calculated the masses of the two objects theoretically, we used a scale to find the mass of the wooden block to be 180.2 and the mass of the tape dispenser to be 600.5 grams. Therefore, our mathematical model was relatively accurate.
CONCLUSION
From this experiment, we became familiar with the relationship between mass and period for an inertial balance. We learned that as the mass on an inertial balance increases, so does the time it takes for the inertial balance to complete two oscillations. In other words, when the mass becomes larger, the period does as well. We also learned that we can use this relationship to create a mathematical model that allows us to calculate unknown masses from their periods.
However, when we compared the theoretical and the measured values of these masses, we noticed that they were not a hundred percent accurate. This is to expected because we know that there are always number of factors that contribute to error in any given experiment. One of the possible factors that caused error in this particular experiment is that the added masses were not completely centered on the tray of the inertial balance. This could have altered the values that we got for the periods. Another source of error was that we did not pull back the same amount of distance before releasing the inertial balance during each trial. This also could have given us inaccurate period values.
Despite the number of reasons for error, we believe that the values were very accurate. This appears to be especially true when we consider all the limitations we had in this experiment. For example, we had no efficient way of keeping the masses steady when they were on the tray of the inertial balance except for by using tape. Therefore, we can conclude that this experiment was a relatively successful one.
No comments:
Post a Comment