Saturday, April 18, 2015

15-Apr-2015: Impulse-momentum principle

PURPOSE

The purpose of this experiment was to analyze three different collisions to see if the impulse-momentum principle holds true.


PROCEDURES

Part 1

Figure 1

We began by setting up the experiment as illustrated in Figure 1 (click to enlarge). As it can be observed from the image, a force sensor was fixed to a cart moving on a track. The hook on the force sensor that actually did the measuring of forces was removed and replaced by a rubber stopper (labeled in red in Figure 1). The purpose of this rubber stopper was to enable the cart to have a direct collision with the red cart at the location marked in green in Figure 1. In addition, a motion sensor was placed at one end of the track as shown in Figure 1 with a blue circle.

Figure 2

After constructing our set-up, we proceeded to give the cart with the force sensor a push toward the stationary cart. We captured the motion of the moving cart with the motion sensor and plotted two graphs on Logger Pro. One was velocity with respect to time and the other was force with respect to time (Figure 2). We used the "Examine" function on the velocity versus time graph to find the velocity of the cart before and after the collision. We assumed that the curved portion of the graph corresponded to the change in velocity during the collision. Therefore, we took the linear parts to be the initial and final velocities. We then applied the "Integral" function on the force versus time graph as shown in Figure 2. The area under this graph was supposed to represent the impulse of the collision.

Figure 3

After analyzing the graphs, we used the values that we found to compare the change in momentum to the impulse of collision. We found the change in momentum by using the initial and final velocities as shown in Figure 3. The resulting value was 0.585 N*s. Referring back to Figure 2, it can be seen that the impulse was 0.5443 N*s. In order to compare these values, we found the percent error, which was 6.97 percent. Therefore, it can be seen that the impulse-momentum theorem holds.

Part 2

Figure 4

For the next part of the experiment, we added 200 g to the moving cart and once again pushed it toward the stationary cart to cause a collision between the two objects. We repeated the same process as the first part of the experiment and plotted velocity and force with respect to time. These graphs are shown in Figure 4. Just as before, we applied the "Examine" tool on the velocity versus time graph to find the initial and final velocities, which we found to be -0.477 m/s and 0.426 m/s, respectively. In addition, we took the integral of the force versus time graph to find the impulse. As it can be seen from the image, the resulting value was 0.6998 N*s.

Figure 5

As we did in the first part of the experiment, we found the change in the momentum from the initial and final velocities. We found this value to be 0.759 N*s. We compared this value to the impulse found from the force versus time graph by calculating the percent error. We found this to be 7.80 percent, which was a similar result to the first part of the experiment. We can conclude from this result that the impulse-momentum theorem held true in this collision. 

Part 3

Figure 6

For the final part of the experiment, we replaced the red cart with clay attached to a wooden stand. We also taped a nail to the end of the rubber stopper. This was done to simulate an inelastic collision. We once again plotted two graphs to find the final and initial velocities of the cart and the impulse of the collision. These graphs are shown in Figure 7 below. After examining the graphs, we noticed that there were some oscillations at the end of the force versus time graph. These oscillations can most likely be attributed to the cart stabilizing as it was coming to a stop.

Figure 7
Figure 8

From the velocity versus time graph, we found the initial velocity to be -0.424 m/s and the final velocity to be zero (which we could have figured out on our own). From these values, we found the change in momentum to be 0.357 N*s. Next, we found the impulse to be 0.3869 N*s by integrating the force versus time graph. The percent error between these values is 7.73 percent, which is an acceptable number. As a result, we can conclude that the impulse-momentum principle holds true for this part of this experiment.

CONCLUSION

We learned from this process that the impulse-momentum principle actually holds true in a real-life situation. This was a valuable experience because we witnessed firsthand that what we learn in the classroom can be tested in an experiment. Furthermore, having practice of these theorems in an experiment, helps us fully understand what these concepts mean.

Like any experiment, there were several factors that could have contributed to error in the values that we found. For example, we assumed in the first two parts that the collisions were elastic. However, they were most likely not completely elastic. Another source of error could have been from the force sensor. Since there was a rubber stopper attached to it, there is a possibility that the force sensor did not properly register the forces being exerted on the cart. This is most likely the reason why the impulses were smaller than the changes in momentum.

Wednesday, April 15, 2015

8-Apr-2015: Conservation of energy of a mass-spring system

PURPOSE

The purpose of this experiment was to apply what we learned about energy and see if a system follows the law of conservation of energy.

PROCEDURES

Figure 1: Derivation of the gravitational potential energy of the spring
Figure 2: Derivation of the kinetic energy of the spring

Before setting up our experiment, we came up with a way to relate the gravitational potential energy and the kinetic energy of the spring to known quantities. We related the gravitational potential energy of the spring to the position of the bottom of the mass hanger shown in Figure 3 (circled in blue). Then, we related the kinetic energy of the spring to the velocity of the bottom of the mass hanger. The derivations of these relationships are shown in Figures 1 and 2 above.

Figure 3: Set-up of our experiment

We started this lab by setting up the system shown in Figure 3. There are a couple of things to note about this set-up. First, the force sensor (circled in green) was calibrated before proceeding with the measurements. Second, an index card was taped to the bottom of the mass hanger (circled in blue) so that the motion sensor (circled in red) could clearly identify its location. The motion sensor was zeroed with the spring unstretched

After constructing our set-up, we added 200 g to the mass hanger and released the system. We allowed the combined masses to oscillate for a few seconds while the motion sensor gathered data. Using the position data, we were able to find the system's elastic and gravitational potential energy. From the velocity data, we calculated the system's kinetic energy. We then found the total energy of the system from these values.

Figure 4: Energy vs time
Figure 5: Energy vs position

Next, we graphed these derived values with respect to time and then with respect to position. These graphs are shown above in Figures 4 and 5. The shapes of these graphs were what we expected to see. In the first graph, it can be seen that the times at which gravitational potential energy was at its maximum, the elastic potential energy was at its minimum. This makes sense because as the mass moves farther away from the ground, it gains more gravitational potential energy. At the same time, the spring becomes less stretched and the elastic potential energy goes down. The slope of the gravitational potential energy versus position graph was positive, while the slope of the kinetic energy versus position graph was negative for the same reasons.

CONCLUSION

In this experiment, we witnessed firsthand that energy is conserved in a system. It was interesting to see that the graphs shown in Figures 4 and 5 were so close to what we expected. However, there were still some disparities between what we expected and the experimental values. There are several possible causes for this result. First, the sample rate at which the data was collected may not have been big enough to fully capture the motion of the system since the system was oscillating at such a fast rate. Another reason why there were disparities between the expected values and the experimental ones may have been that the position of the bottom of the mass hanger may not have been recorded correctly by the motion sensor. Since there was so much movement by the mass hanger, its bottom may not have been in clear view of the motion sensor at all times.

Despite these sources of error, we were able to get results that were relatively accurate. Therefore, we concluded that our experiment was a success.

13-Apr-2015: Magnetic potential energy

PURPOSE

The purpose of this experiment was to practice conservation of energy problems in a real-life situation.

PROCEDURES

Figure 1: Initial set-up of air track and cart
Figure 2: Air generator

We commenced this experiment by constructing the set-up shown in Figure 1. The set-up consisted of a track connected to an air generator (Figure 2) with a tube at the location marked by the red circle. The air produced from this generator allowed the cart (circled in green) to move on a virtually frictionless surface. In addition, there were magnets at the end of the track and on the front of the cart. There was a magnetic potential energy between these magnets that was inversely related to distance.

Figure 3: Altered set-up with track at an angle
Figure 4: Books were used to place the track at an angle

After constructing the set-up, we proceeded to place the track at an angle by using books (Figures 3 and 4). We then turned on the air generator and allowed the cart to stabilize before we turned it off. We measured the resulting distance between the magnets. We repeated this process four more times, increasing the angle of the track each time. The angles and their corresponding separation distances are listed below in Figure 5.

Figure 5: Data table
Figure 6: Newton's second law


From the gathered data, we were able to find the force between the magnets (F_m) by applying Newton's second law in the x-direction as shown in Figure 6. Then, we plotted F_m with respect to the separation distance (Figure 7). We applied a Power Fit to this graph to get a function for the magnetic force. We integrated this function with respect to the separation distance in order to find the potential energy between the magnets. This process is displayed in Figure 8 below.

Figure 7: Magnetic force vs separation distance
Figure 8: Function of magnetic potential energy

Once we found a function for the potential energy between the magnets, we removed the books from under the track and made sure the track was level. Moreover, we set up a motion sensor to track the cart's velocity and the distance between the magnets. Then, we turned on the air generator and gave the cart a push. From the measurements we made with the motion sensor, we were able to create calculated columns for the kinetic energy of the cart and the potential energy between the magnets. From these energy values, we also found the total energy of the system. We plotted these three energies with respect to time (Figure 9).

Figure 9: Energy vs time

Based on our knowledge on the conservation of energy, we expected to see a constant total energy throughout the cart's motion. As it can be seen from Figure 9, our experiment was a moderate success since the total energy was mostly constant with the exception of two parts in the graph. Furthermore, the shapes of the kinetic energy and potential energy graphs were very close to what we expected. We expected the energies to essentially be inverses of each other, which is pretty much what we saw.

CONCLUSION

As discussed earlier, this experiment was somewhat successful as the graphs of the energies with respect to time had shapes that were similar to what we expected. There are several factors that could have contributed to the graphs not having the exact shapes that we expected. One possible reason is that the cart was not completely stable throughout its motion, especially when it reached the magnet at the end of the track and bounced back. This could have affected the data that we gathered on the cart's velocity, which in turn would have affected the values we found for the kinetic energy of the cart. This makes sense because the dips in the total energy graph that we saw in the Figure 9 were due to the kinetic energy graph. Another reason why the results were a hundred percent accurate was the measurements we made on the separation distances. Since we used a ruler to make these measurements, we could not make measurements that were very accurate.

6-Apr-2015: Work-kinetic energy theorem

PURPOSE

The purpose of this experiment was to exercise our knowledge of the work-energy principle and witness first-hand if the principle holds true.

PROCEDURES


Experiment 1

Figure 1: Initial set-up

The first thing we did in this part of the lab was set up the system shown in Figure 1. As it can be seen from the image, a cart (circled in blue) was connected to a force sensor (circled in red) with a spring. A motion sensor (not shown) was placed at the opposite end to track the motion of the cart. Both sensors were zeroed with the spring supported loosely and unstretched. Then, we slowly pulled the cart approximately 0.6 m away from the force sensor.

Figure 2: Spring force vs position

The force that the spring applied on the force sensor as a result of the pull was graphed with respect to position. This graph is displayed in Figure 2 (click to enlarge). From the graph, we were able to find the spring constant (k) of the spring from the slope of the graph (refer to the formula below).

F = kx
=> k = F/x

Experiment 2

Using the same set-up as before, we conducted the second part of the experiment. This time we pulled the cart around 0.62 m away from the force sensor and let it go. During this process, we measured the force applied by the spring and the velocity of the cart . From the spring force, we were able to find the work done by the spring over a displacement by taking the integral of the force versus position graph. From the velocity of the cart, we were able to find the cart's kinetic energy at any given position.

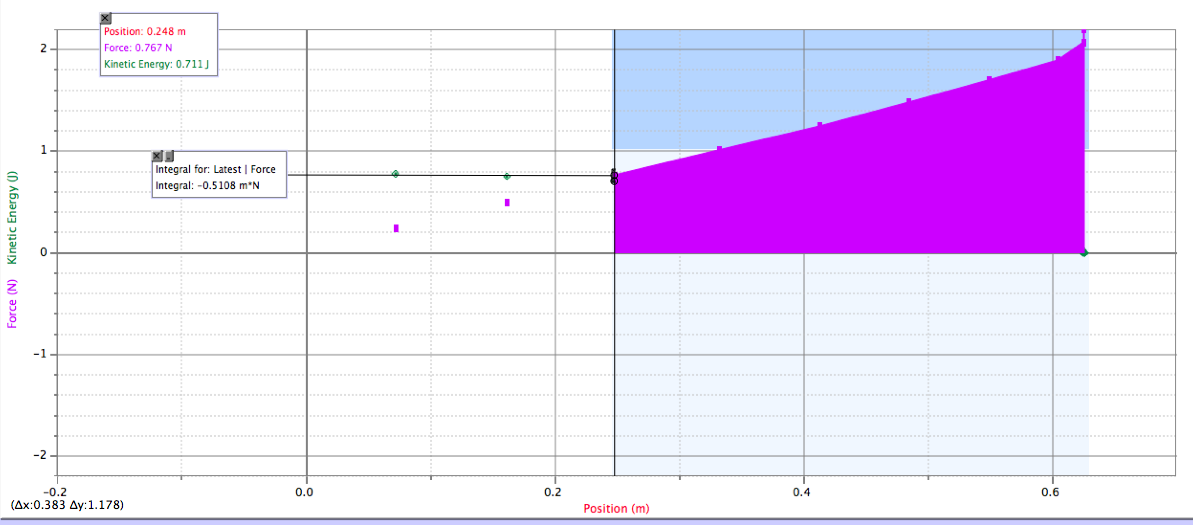
Figure 3: Force and kinetic energy vs position (1)
Figure 4: Force and kinetic energy vs position (2)

The resulting graphs are shown above in Figures 3 and 4 (click to enlarge). We analyzed the graphs from the starting position to two different positions and compared the kinetic energy of the cart at that position with the amount of work done by the spring. Since the cart started at rest, the initial kinetic energy was zero. Therefore, the kinetic energy at any given position was the same as the change in kinetic energy. Since the spring force was the only force doing work on the cart, these values were supposed to be equal according to the work-energy principle. However, it can be seen from the graphs that they were not.

CONCLUSION

In the second part of the experiment, we compared the work done on the cart by the spring and the change in kinetic energy of the cart over a given displacement. We did this over two different displacements. For the first displacement (Figure 3), we found the work to be 0.437 J and the change in kinetic energy to be 0.654 J. For the second displacement (Figure 4), the work was 0.511 J and the kinetic energy was 0.711 J. The percent error from the two cases was 33.3 percent and 28.2 percent, respectively, which is alarmingly high. This result could be attributed to a number of factors. One possible cause for so much error was that the sample rate of the motion sensor was too low. This could have produced inaccurate readings for the velocities that we used to calculate the changes in kinetic energy. Another possible source of error could have been the force sensor. Since the spring was not completely secure in the hook of the force sensor, some of the spring force may not have registered. This is most likely why the work was smaller than the change in kinetic energy.

Experiment 3


For the final part of this experiment, we watched a video of a professor conducting an experiment using analog instruments. In the video, the professor pulled on a rubber band, which was connected to a analog force transducer. The measurements made by the force transducer were plotted on a graph, shown in Figure 5 above. From this graph, we calculated the total work done by finding the area under the graph. We accomplished this task by breaking the area under graph into triangles, rectangles, and trapezoids. By using this technique, we found the total work to be approximately 25.675 J.

Later in the video, the rubber band was attached to a known mass. The professor then released the rubber band and the mass passed through two photogates. We found its velocity by dividing the distance between the photogates by the time it took for the mass go through them. We used this velocity to find the mass' final kinetic energy. Assuming the mass' initial kinetic energy to be zero (since it started from rest), we concluded that the final kinetic energy was equal to the change in kinetic energy. We found this value to be 23.89 J.

CONCLUSION

During this part of the experiment, we found the total work done on a rubber band as it was pulled over a distance. This work was converted into kinetic energy when the rubber band was released and a mass that was attached to the rubber band was given a velocity. We found the change in kinetic energy of the mass during this process and compared this value to the total work done on the rubber band. According to the work-energy theorem, these values should have been equal. The values were actually relatively close to each other. In fact, the percent error was only 6.95 percent. Given the limitations of the technology used in this experiment, this result was quite impressive.

There were a number of factors that could have been sources of error in this experiment. One possible source of error could have been the analog force transducer. It is possible that the instrument was considerably inaccurate. The distance between the photogates to find the mass' velocity could also have been a source of error as it is could have been measured incorrectly. Another source of error could have been the analysis of the force versus position graph. We made an estimate of the area under the graph (the actual graph had many oscillations and did not have a distinct shape), so the total work done on the rubber band that we found may not have been as precise as we wanted.

1-Apr-2015: Centripetal force with a motor

PURPOSE

The purpose of this experiment was to use the relationship between centripetal acceleration and angular speed to find the theoretical value of angular speed and compare it to the value that we found experimentally. 

PROCEDURES

Figure 1: Spinning apparatus

This experiment was conducted with the set-up shown above (Figure 1). The apparatus consisted of a motor (circled in blue) that spun around a hanging mass (circled in red). In addition, a piece of paper was attached to a ring stand (Figure 2) whose height was adjusted until the hanging mass just barely grazed the piece of paper. The purpose of this step was to determine the distance between the mass and the ground (h), which we would use later to find θ.

Figure 2: 2D drawing of the set-up, where H = 2.0 m, L = 0.9 m and R = 1.645 m

We ran the experiment with the motor spinning at six different speeds and recorded the time it took for the mass to make ten revolutions. As we increased the mass' speed, h increased as well. From h, we were able to find θ by taking the inverse cosine of L/(H-h). The data that we gathered is displayed below in Figure 3.

Figure 3: Data table
From this data, we were able to find ω by applying Newton's second law of motion in the x- and y-directions and combining the equations together. This process is illustrated in Figure 4 below. One thing to note about this equation is that r was not equal to R = 2.0 m. Instead, it was equal to R + Lsinθ since r is the distance between the axis of rotation and the rotating mass.

Figure 4: Mathematical process used to find ω

Rather than solving for ω by hand six different times, we decided to carry out the task in excel. Next, we used a second approach to find ω. We first found the time it took for the mass to complete one revolution by dividing t_10 by ten. Then, we divided 2π rad by this value to find ω. The results are shown below in Figures 5 and 6.

Figure 5: Resulting ω values from first approach
Figure 6: Resulting ω values from second approach

Finally, we plotted the resulting ω values against each other to see how accurate our measurements were. We did this by looking at the slope of the graph. If we were a hundred percent accurate with our measurements, the slope of the graph should have been equal to one. As it can be seen from the graph in Figure 7, the slope was 1.0399 and was actually very close to our expected value.

Figure 7: Graph of values found from second approach vs values found from first approach

CONCLUSION

In this experiment, we applied our knowledge on centripetal acceleration and how it relates to Newton's second law of motion in a real-life situation. Then, we compared our theoretical values to our experimental values and found that we were relatively successful in properly carrying out this experiment. In fact, our percent error was only 3.99 percent. Given the circumstances, this result was as accurate as it could have been. There are a few reasons why the result was not and could not have been a hundred percent accurate. First, the measurements that we made for the different lengths could not have been completely accurate because we were limited by the tools that we used to make the measurements. Another reason why our result could not have been fully accurate was that we ignore the effects of air resistance in our calculations. Although air resistance may not have played a significant role on such a small object, it could have been enough to affect the results noticeably since the object was moving at high speeds.

Wednesday, April 1, 2015

25-Mar-2015: Centripetal acceleration vs angular speed

PURPOSE

The purpose of this experiment was to extend our theoretical knowledge of the relationship between centripetal acceleration and angular speed to a real-life experiment.

PROCEDURES

Figure 1: Set-up consisting of a disk, accelerometer, photogate, and power supply

This experiment was conducted by the professor as a demonstration to the entire class. The set-up shown in Figure 1 consisted of an accelerometer (circled in blue) confined to a rotating disk that was powered by a voltage supply (circled in purple). A piece of tape (circled in green) was protruding out of the disk to enable the photogate (circled in red) record the time of the disk's rotations. The professor varied the power supply six times, increasing it each time. We took note of the time it took the disk to rotate ten times for each voltage. In addition, the accelerometer measured the centripetal acceleration of the disk during each trial.

Figure 2: Data table

The data we gathered from the experiment is displayed in Columns 2, 3, and 7, of the data table shown in Figure 2. We found the time it took for the disk to rotate once by subtracting the second column from the the third column and dividing the resulting value by ten. Then, we found the angular speed by dividing 2π by the value we found in the previous step. Finally, we squared the angular speed and recorded the values in Column 6.

Figure 3: Centripetal acceleration vs angular speed squared

After recording our data, we graphed centripetal acceleration with respect to the square of angular speed (Figure 3). Since centripetal acceleration equals the radius times the square of the angular speed (refer to the formula below), we concluded that the slope of this graph must equal the distance between the center of the disk and the location of the accelerometer. We measured this distance to be somewhere between 13.8 cm to 14.0 cm. Since the slope of the graph is in terms of meters, it can be seen that the experimental value was very close to the expected value.

ac = ω²r
=> r = ac/ω²

CONCLUSION

In this experiment, we implemented our knowledge on centripetal acceleration and angular speed. The experiment was successful since the experimental value was very close to the expected value. In fact, the percent error was only 1.4 percent (assuming the measured radius to be 13.9 cm). Since the percent error is well below 5 percent, we can conclude that we executed the lab correctly.

There may have been a few sources of error since the experimental value was not a hundred percent accurate. First, the distance between the center of the disk and the accelerometer may have been measured incorrectly. Since we used a ruler to measured the distance, we were limited in our ability to be accurate. Another possible source of error was the measurements taken by the photogate. There is no guarantee that the measurements made by the photogate was a hundred percent accurate.

23-Mar-2015: Trajectory

PURPOSE

The purpose of this experiment was to implement the concepts we learned about kinematic equations and analyze a body in free-fall motion.

PROCEDURES


We began this experiment by constructing the set-up shown above (Figure 1). Then, we measured the vertical distance from the end of the bottom track to the floor. Next, we released a uniform sphere from the location marked by the red arrow in Figure 1. We observed where the sphere landed on the floor and placed a piece of carbon paper on that location (Figure 2). We put a piece of blank white paper underneath the carbon paper to mark where the sphere landed after falling from the end of the track.


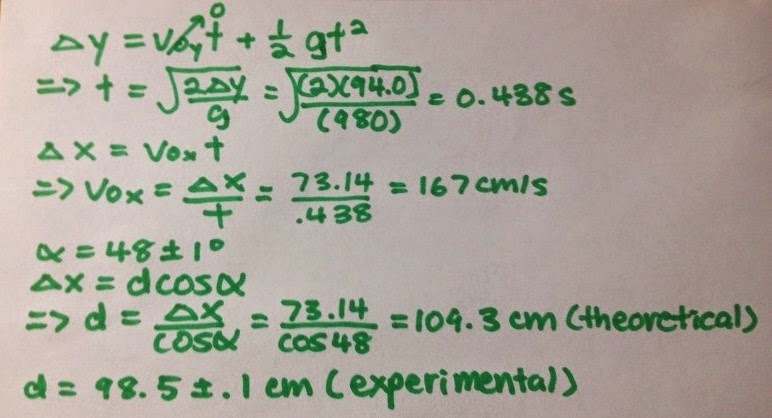
After taping the carbon paper to the floor, we released the sphere from the same marked location five times. We measured the horizontal distance from the end of the track to each of the marks and took the average of the five measurements. The resulting value was 73.14 cm. Then, we derived the time it took for the ball to land on the floor based on the vertical distance between the end of the track and the floor. Using this information and the average horizontal displacement of the sphere, we found the horizontal component of the sphere's velocity. We also used the sphere's average horizontal displacement to predict where the sphere would land in the next part of the experiment. The mathematical processes of these derivations are displayed in Figure 3 below.

Figure 3: Derivations of theoretical values + experimental value
Figure 4: Set-up of the second part of the experiment

For the second part of our lab, we placed a wooden board at the edge of the table as shown in Figure 4. The wooden board stood at an angle with the floor, which we measured by using our phones. We released the sphere from the marked location just as we did in the first part and took note of the general area in which the sphere landed on the wooden board. We taped carbon paper with a blank paper underneath in this general area to mark the landing location of the sphere. Then, we released the sphere from the same location five times and measured the distance from the beginning of the board to the marked locations. We took an average of these five values, which was 98.5 cm (Figure 3).

Figure 5: Derivation of the equation used to find propagated uncertainty

After conducting the second part of the experiment, we set the two kinematic equations used in Figure 3 equal to time and then set it equal to each other. Then, set the resulting equation to d (the distance from the end of the track to the landing spot of the sphere on the board) in order to derive an equation that would allow us to find the propagated uncertainty of the measurements that we made. This process is shown in Figure 5 above.

Figure 6: Propagated uncertainty
Figure 7: Partial derivative with respect to α

From the equation displayed in Figure 5, we found propagated uncertainty by taking the partial derivatives of the equation with respect to x, y and α. The process is shown in Figure 6. The equation's partial derivatives with respect to x and y were relatively easy to find. On the other hand, the partial derivative with respect to α was rather difficult. Therefore, the steps we took to find it is illustrated separately in Figure 7. However, when we reached the resulting value, we realized that we must have done the math incorrectly because the value was bigger than the measurement itself. Therefore, we could not use the propagated uncertainty to compare the experimental and theoretical values.

CONCLUSION

Although we were unable to see the accuracy of our experimental values based on the propagated uncertainty, we found the percent error instead. Our percent error in this experiment was 9.88 percent. This was slightly higher than we would have preferred. This result could be attributed to the sphere that we used, It could have been not completely uniform, which would have affected its motion. Another source of error was when we made the distance measurements. Since we used a ruler, it was probably not very accurate. In addition, the angle that we measured may not have been very accurate. The phone that we used to make the measurement may have been calibrated incorrectly.