PURPOSE
The purpose of this experiment was to implement the concepts we
learned about kinematic equations and analyze a body in free-fall motion.
PROCEDURES

We began this experiment by constructing the set-up shown above (Figure 1). Then, we measured the vertical distance from the end of the
bottom track to the floor. Next, we released a uniform sphere from the location
marked by the red arrow in Figure 1. We observed where the sphere landed on the floor and placed a
piece of carbon paper on that location (Figure 2). We put
a piece of blank white paper underneath the carbon paper to mark where the
sphere landed after falling from the end of the track.

After taping the carbon paper to the floor, we released the sphere
from the same marked location five times. We measured the horizontal distance
from the end of the track to each of the marks and took the average of the five measurements. The resulting value was 73.14 cm. Then, we derived the time it took for the ball to land on the floor based on the vertical distance between the end of the track and the floor. Using this information and the average horizontal displacement of the sphere, we found the horizontal component of the sphere's velocity. We also used the sphere's average horizontal displacement to predict where the sphere would land in the next part of the experiment. The mathematical processes of these derivations are displayed in Figure 3 below.
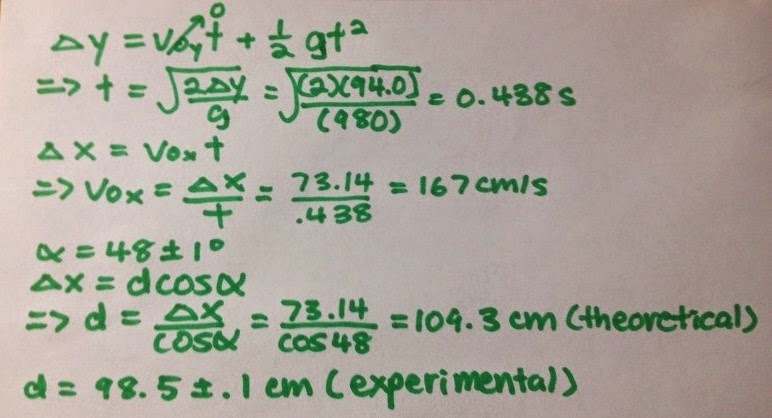 |
| Figure 3: Derivations of theoretical values + experimental value |
 |
| Figure 4: Set-up of the second part of the experiment |
For the second part of our lab, we placed a wooden board at the
edge of the table as shown in Figure 4. The wooden board stood at an angle with
the floor, which we measured by using our phones. We released the sphere from the marked location
just as we did in the first part and took note of the general area in which the
sphere landed on the wooden board. We taped carbon paper with a blank paper
underneath in this general area to mark the landing location of the sphere.
Then, we released the sphere from the same location five times and measured the
distance from the beginning of the board to the marked locations. We took an average of these five values, which was 98.5 cm (Figure 3).
After conducting the second part of the experiment, we set the two kinematic equations used in Figure 3 equal to time and then set it equal to each other. Then, set the resulting equation to d (the distance from the end of the track to the landing spot of the sphere on the board) in order to derive an equation that would allow us to find the propagated uncertainty of the measurements that we made. This process is shown in Figure 5 above.
From the equation displayed in Figure 5, we found propagated uncertainty by taking the partial derivatives of the equation with respect to x, y and α. The process is shown in Figure 6. The equation's partial derivatives with respect to x and y were relatively easy to find. On the other hand, the partial derivative with respect to α was rather difficult. Therefore, the steps we took to find it is illustrated separately in Figure 7. However, when we reached the resulting value, we realized that we must have done the math incorrectly because the value was bigger than the measurement itself. Therefore, we could not use the propagated uncertainty to compare the experimental and theoretical values.
CONCLUSION
Although we were unable to see the accuracy of our experimental values based on the propagated uncertainty, we found the percent error instead. Our percent error in this experiment was 9.88 percent. This was slightly higher than we would have preferred. This result could be attributed to the sphere that we used, It could have been not completely uniform, which would have affected its motion. Another source of error was when we made the distance measurements. Since we used a ruler, it was probably not very accurate. In addition, the angle that we measured may not have been very accurate. The phone that we used to make the measurement may have been calibrated incorrectly.
 |
| Figure 5: Derivation of the equation used to find propagated uncertainty |
After conducting the second part of the experiment, we set the two kinematic equations used in Figure 3 equal to time and then set it equal to each other. Then, set the resulting equation to d (the distance from the end of the track to the landing spot of the sphere on the board) in order to derive an equation that would allow us to find the propagated uncertainty of the measurements that we made. This process is shown in Figure 5 above.
 |
| Figure 6: Propagated uncertainty |
 |
| Figure 7: Partial derivative with respect to α |
From the equation displayed in Figure 5, we found propagated uncertainty by taking the partial derivatives of the equation with respect to x, y and α. The process is shown in Figure 6. The equation's partial derivatives with respect to x and y were relatively easy to find. On the other hand, the partial derivative with respect to α was rather difficult. Therefore, the steps we took to find it is illustrated separately in Figure 7. However, when we reached the resulting value, we realized that we must have done the math incorrectly because the value was bigger than the measurement itself. Therefore, we could not use the propagated uncertainty to compare the experimental and theoretical values.
CONCLUSION
Although we were unable to see the accuracy of our experimental values based on the propagated uncertainty, we found the percent error instead. Our percent error in this experiment was 9.88 percent. This was slightly higher than we would have preferred. This result could be attributed to the sphere that we used, It could have been not completely uniform, which would have affected its motion. Another source of error was when we made the distance measurements. Since we used a ruler, it was probably not very accurate. In addition, the angle that we measured may not have been very accurate. The phone that we used to make the measurement may have been calibrated incorrectly.
No comments:
Post a Comment