PURPOSE
The purpose of this experiment was to exercise our knowledge of the work-energy principle and witness first-hand if the principle holds true.
PROCEDURES
Experiment 1
 |
| Figure 1: Initial set-up |
The first thing we did in this part of the lab was set up the system shown in Figure 1. As it can be seen from the image, a cart (circled in blue) was connected to a force sensor (circled in red) with a spring. A motion sensor (not shown) was placed at the opposite end to track the motion of the cart. Both sensors were zeroed with the spring supported loosely and unstretched. Then, we slowly pulled the cart approximately 0.6 m away from the force sensor.
 |
| Figure 2: Spring force vs position |
The force that the spring applied on the force sensor as a result of the pull was graphed with respect to position. This graph is displayed in Figure 2 (click to enlarge). From the graph, we were able to find the spring constant (k) of the spring from the slope of the graph (refer to the formula below).
F = kx
=> k = F/x
Experiment 2
Using the same set-up as before, we conducted the second part of the experiment. This time we pulled the cart around 0.62 m away from the force sensor and let it go. During this process, we measured the force applied by the spring and the velocity of the cart . From the spring force, we were able to find the work done by the spring over a displacement by taking the integral of the force versus position graph. From the velocity of the cart, we were able to find the cart's kinetic energy at any given position.
 |
| Figure 3: Force and kinetic energy vs position (1) |
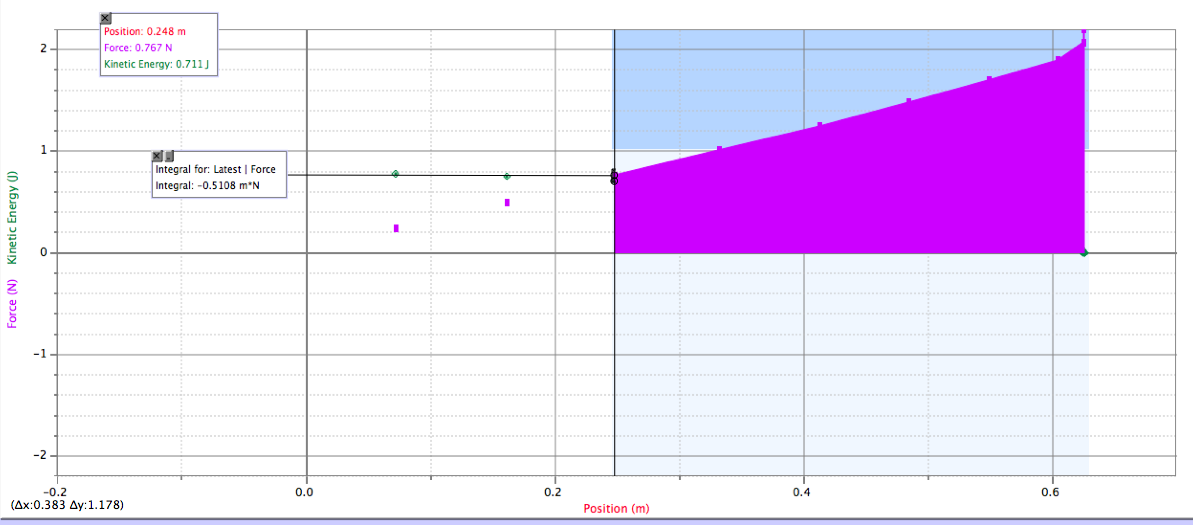 |
| Figure 4: Force and kinetic energy vs position (2) |
The resulting graphs are shown above in Figures 3 and 4 (click to enlarge). We analyzed the graphs from the starting position to two different positions and compared the kinetic energy of the cart at that position with the amount of work done by the spring. Since the cart started at rest, the initial kinetic energy was zero. Therefore, the kinetic energy at any given position was the same as the change in kinetic energy. Since the spring force was the only force doing work on the cart, these values were supposed to be equal according to the work-energy principle. However, it can be seen from the graphs that they were not.
CONCLUSION
In the second part of the experiment, we compared the work done on the cart by the spring and the change in kinetic energy of the cart over a given displacement. We did this over two different displacements. For the first displacement (Figure 3), we found the work to be 0.437 J and the change in kinetic energy to be 0.654 J. For the second displacement (Figure 4), the work was 0.511 J and the kinetic energy was 0.711 J. The percent error from the two cases was 33.3 percent and 28.2 percent, respectively, which is alarmingly high. This result could be attributed to a number of factors. One possible cause for so much error was that the sample rate of the motion sensor was too low. This could have produced inaccurate readings for the velocities that we used to calculate the changes in kinetic energy. Another possible source of error could have been the force sensor. Since the spring was not completely secure in the hook of the force sensor, some of the spring force may not have registered. This is most likely why the work was smaller than the change in kinetic energy.
Experiment 3

For the final part of this experiment, we watched a video of a professor conducting an experiment using analog instruments. In the video, the professor pulled on a rubber band, which was connected to a analog force transducer. The measurements made by the force transducer were plotted on a graph, shown in Figure 5 above. From this graph, we calculated the total work done by finding the area under the graph. We accomplished this task by breaking the area under graph into triangles, rectangles, and trapezoids. By using this technique, we found the total work to be approximately 25.675 J.
Later in the video, the rubber band was attached to a known mass. The professor then released the rubber band and the mass passed through two photogates. We found its velocity by dividing the distance between the photogates by the time it took for the mass go through them. We used this velocity to find the mass' final kinetic energy. Assuming the mass' initial kinetic energy to be zero (since it started from rest), we concluded that the final kinetic energy was equal to the change in kinetic energy. We found this value to be 23.89 J.
CONCLUSION
During this part of the experiment, we found the total work done on a rubber band as it was pulled over a distance. This work was converted into kinetic energy when the rubber band was released and a mass that was attached to the rubber band was given a velocity. We found the change in kinetic energy of the mass during this process and compared this value to the total work done on the rubber band. According to the work-energy theorem, these values should have been equal. The values were actually relatively close to each other. In fact, the percent error was only 6.95 percent. Given the limitations of the technology used in this experiment, this result was quite impressive.
There were a number of factors that could have been sources of error in this experiment. One possible source of error could have been the analog force transducer. It is possible that the instrument was considerably inaccurate. The distance between the photogates to find the mass' velocity could also have been a source of error as it is could have been measured incorrectly. Another source of error could have been the analysis of the force versus position graph. We made an estimate of the area under the graph (the actual graph had many oscillations and did not have a distinct shape), so the total work done on the rubber band that we found may not have been as precise as we wanted.
No comments:
Post a Comment